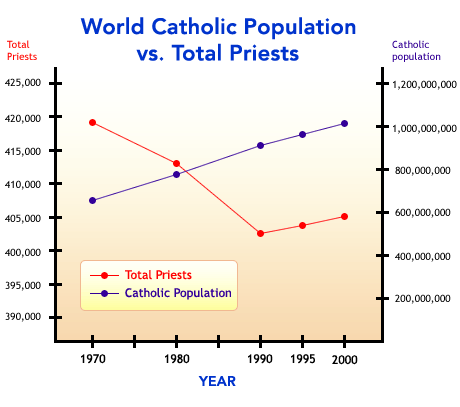
Changes in the Priesthood Throught the World, 1970 to 2000
| World Data | 1970 | 1980 | 1990 | 1995 | 2000 |
| Diocesan priests | 270,924 | 257,409 | 257,696 | 262,418 | 265,781 |
| Religious priests | 148,804 | 156,191 | 145,477 | 142,332 | 139,397 |
| Total priests | 419,728 | 413,600 | 403,173 | 404,750 | 405,178 |
| Diocesan Priestly ordinations | 4,622 | -- | 5,938 | 6,444 | 6,814 |
| Grad. level seminarians | -- | 33,731 | 51,603 | 54,154 | 55,968 |
| Permanent deacons | 309 | 7,654 | 17,525 | 22,390 | 27,824 |
| Religious brothers | -- | 73,090 | 62,526 | 59,515 | 55,057 |
| Religious sisters | -- | 960,991 | 882,111 | 837,961 | 801,185 |
| Parishes | 191,438 | 206,503 | 215,805 | 220,077 | 218,196 |
| Without Resident Priests | -- | 94,846 | 107,566 | 110,502 | 105,530 |
| Catholic population | 653,500,000 | 783,700,000 | 928,500,000 | 989,400,000 | 1,045,000,000 |
Changes in the Priesthood in the U.S., 1965 to 2003
| U.S. Data | 1965 | 1985 | 1995 | 2003 |
| Diocesan priests | 35,925 | 35,052 | 32,349 | 29,285 |
| Religious priests | 22,707 | 22,265 | 16,705 | 14,349 |
| Total priests | 58,632 | 57,317 | 49,054 | 43,634 |
| Priestly ordinations | 994 | 533 | 511 | 441 |
| Grad. level seminarians | 8,325 | 4,063 | 3,172 | 3,414 |
| Permanent deacons | -- | 7,204 | 10,932 | 13,635 |
| Religious brothers | 12,271 | 7,544 | 6,535 | 5,499 |
| Religious sisters | 179,954 | 115,386 | 90,809 | 73,316 |
| Parishes | 17,637 | 19,244 | 19,331 | 19,081 |
| Without resident priest | 549 | 1,051 | 2,161 | 3,040 |
| Catholic population | 45,600,000 | 52,300,000 | 57,400,000 | 63,400,000 |
| Percent of US Population | 24% | 23% | 23% | 22% |
Statistics and charts come from Georgetown University's Center for Applied Research in the Apostolate.

